High-Inclination (~60°) Heel Perforations in Alberta Horizontal Wells
Verified Examples and Subsurface Data Study
Built with Gemini Argon 4 and frac.fyi MCP
October 2026
Disclaimer
Disclaimer: This report was produced using Gemini Argon 4 and the frac.fyi MCP server through automated AI queries and statistical aggregation of Alberta Energy Regulator (AER) records. AI-assisted analysis may contain interpolation approximations, reporting lags, classification artifacts, data-processing errors, or other inaccuracies.
This document is provided for informational and analytical purposes only. It is not engineering, operational, investment, legal, or regulatory advice, and it is not an official AER publication or endorsement of AER data. Do not rely on this report for well design, drilling, completions, artificial lift, production optimization, reserve estimation, regulatory compliance, or operational decision-making without independent verification against source records and review by a qualified, licensed professional.
The author makes no representations or warranties, express or implied, regarding the accuracy, completeness, currency, reliability, or fitness for any particular purpose of the information contained herein, and accepts no liability for any loss, damage, cost, or decision arising from its use.
01Executive Summary
Systematic basin-wide screening of directional wellbore surveys and audited perforation records in the Western Canadian Sedimentary Basin (WCSB) confirms that placing perforations and hydraulic fracture stages within the build and transitional heel section of horizontal wells—including verified completions initiated at 50° to 60° inclination from vertical—is a documented, recurring completion practice in Alberta. Rather than representing surveying errors or accidental uphole misfires, high-angle heel stages occur systematically in cased-hole Plug-and-Perf (PnP) horizontal completions targeting thick unconventional reservoirs, led by the Montney and Duvernay formations.
To establish a transparent, reproducible denominator from the frac.fyi database, all 541,321 licensed Alberta wells (wells view) were cross-referenced against three-dimensional directional surveys (wellbore view, covering 143,815 Alberta wells with up to 80 downsampled 3D vertices [x, y, z, md] in metres relative to surface where TVD = -z) and audited perforation and treatment interval filings (perf_wells and perf_events views, encompassing 27,204 wells and 1,924,023 interval records). Within the frac.fyi database structure, directional wellbore vertices (wellbore) are available exclusively for Alberta licences (bc_wellbore_matches = 0), whereas British Columbia completion records (bc_perf_wells, bc_frac_stages) do not link to 3D directional survey trajectories. Accordingly, exact measured-depth (MD) inclination interpolation is anchored to the Alberta horizontal well population.
Intersecting wells, wellbore, and perf_wells yields 24,320 matched Alberta wells, of which 22,644 are horizontal wells (UPPER(drilling_operation_type) = 'HORIZONTAL' or lateral_m > 500 m). For every horizontal well, segment chord inclination θ_seg,k (measured in degrees from vertical, verified in the source data where 0° is vertical downward, 90° is horizontal, and >90° is toe-up) was computed across each survey interval [md_k, md_{k+1}] via exact 3D trigonometry, and continuous linear interpolation was performed using length-weighted vertex inclinations θ_vert,k at the top (top_m), midpoint (mid_m), and base (base_m) of each perforation interval. Four data-screening filters separate distinct completion hardware and historical workover artifacts:
- True Horizontal Laterals vs. Deviated Slant Wells: Out of 22,644 horizontal-classified wells with surveys and completion records, 22,614 wells (99.87%) reach a maximum wellbore inclination
θ_max ≥ 85.0°(22,612reach≥ 88.0°), whereas 30 wells (0.13%) never reach85.0°(steeply dipping or slant wells, isolated from horizontal lateral cohorts). - Removal of Shallow Uphole Remedial Squeezes (225 Wells): Among the 5,790 true horizontal wells containing explicit gun or hydra-jet perforation rows (
legacy_code IN ('02','05','03','01','04')within survey coverage), 300 wells exhibit a raw minimum perforation depth at<50°inclination. Cross-checking against hydraulic fracture stage tops (min_stage_top) shows that 225 of those 300 wells are shallow remedial cement squeezes (legacy_code51–58), intermediate casing patches, or later vertical uphole recompletions sitting>50 mabove the shallowest fracture stage or>600 m MDabove the85°landing point. - Separating True Full-Lateral Plug-and-Perf (N = 4,924) from Hybrid Sleeve+Perf (N = 626): Among the 5,589 quality-controlled perforated horizontal wells (requiring
θ_max ≥ 85°,|MD_well - MD_survey| ≤ 50 m, survey segment≤ 200 m, and first perforation within50 mofmin_stage_topand within600 m MDof the85°landing point), 4,924 wells are True Full-Lateral Plug-and-Perf (PnP) completions where explicit perforation intervals span all fracture stages (n_perf_rows >= n_stages, averaging 39.0 stages and 205.6 perforation intervals per well). Another 626 wells (1 <= n_perf_rows < n_stages, averaging 31.6 stages and 8.8 perf rows) are Hybrid Sliding-Sleeve + Gun-Perf completions where the lateral was stimulated with open-hole sleeves while 1–3 gun perforations were shot either at the toe (90°) or in the upper build curve (20°–45°). - Pure Sliding-Sleeve Reference Population (N = 16,983): Horizontal wells completed exclusively with open-hole or cemented ball-drop sleeves (
completion_type = 'Sleeve', no gun perforation rows) are evaluated separately at their shallowest reported fracture stage (min_stage_top).
Table 1 — Transparent Basin-Wide Screening Denominator and Prevalence Across Inclination Bands (Alberta WCSB)
| Inclination Band (° from Vertical) | Raw Perf Hz (N=5,790) | QC All Perf (N=5,589) | True Full PnP (N=4,924) | Full PnP Share (%) | PnP Med Span (m) | Pure Sleeve (N=16,983) | Sleeve Share (%) |
|---|---|---|---|---|---|---|---|
| < 50.0° (Upper build section) | 300 (5.18%)* | 45 (0.81%) | 13 | 0.26% | 2,571.0 | 44 | 0.26% |
| 50.0° – 60.0° (Steep build section) | 95 (1.64%) | 72 (1.29%) | 63 | 1.28% | 2,690.5 | 45 | 0.26% |
| 60.0° – 70.0° (High-angle heel) | 342 (5.91%) | 278 (4.97%) | 264 | 5.36% | 2,608.8 | 185 | 1.09% |
| 70.0° – 80.0° (Transitional heel) | 1,069 (18.46%) | 1,180 (21.11%) | 1,149 | 23.33% | 2,584.0 | 831 | 4.89% |
| 80.0° – 85.0° (Near-horizontal heel) | 949 (16.39%) | 1,137 (20.34%) | 1,096 | 22.26% | 2,431.2 | 1,757 | 10.35% |
| 85.0° – 95.0° (Conventional lateral ref.) | 3,035 (52.42%) | 2,876 (51.46%) | 2,338 | 47.48% | 2,265.0 | 14,109 | 83.08% |
| > 95.0° (Steeply toe-up heel) | 0 (0.00%) | 1 (0.02%) | 1 | 0.02% | 1,982.0 | 12 | 0.07% |
| Cumulative < 70° / < 80° Total | 737 / 1,806 | 395 / 1,575 | 340 / 1,489 | 6.90% / 30.24% | 2,618.0 | 274 / 1,105 | 1.61% / 6.51% |
02Prevalence Across Wellbore Inclination Screening Bands
Table 1 and Plot C show a clear separation between cased-hole Plug-and-Perf (PnP) and open-hole Sliding-Sleeve completions. Among the 4,924 QC-validated True Full-Lateral PnP horizontal wells, nearly one-third (1,489 wells, or 30.24%) initiate their shallowest perforation cluster below 80.0° inclination, 340 wells (6.90%) initiate below 70.0°, and 76 wells (1.54%) initiate in the steep build section below 60.0°. By contrast, in Pure Sliding-Sleeve (Sleeve, N = 16,983) horizontal wells, 83.08% (14,109 wells) initiate within the 85.0°–95.0° conventional horizontal window, and only 1.61% (274 wells) initiate below 70.0°.
This difference tracks completion hardware geometry: in open-hole ball-drop sliding-sleeve systems, open-hole packers and sleeve housings must seal against an un-cemented borehole wall, and high dogleg curvature (5°–8°/30 m) in the 55°–80° build section decentralizes the liner and constrains packer placement until the well lands near 88°–90°. Conversely, in cemented cased-hole Plug-and-Perf completions, production casing is cemented continuously through the build section, allowing wireline guns and composite frac plugs to be placed at 55°–75° inclination whenever the build section traverses target pay.
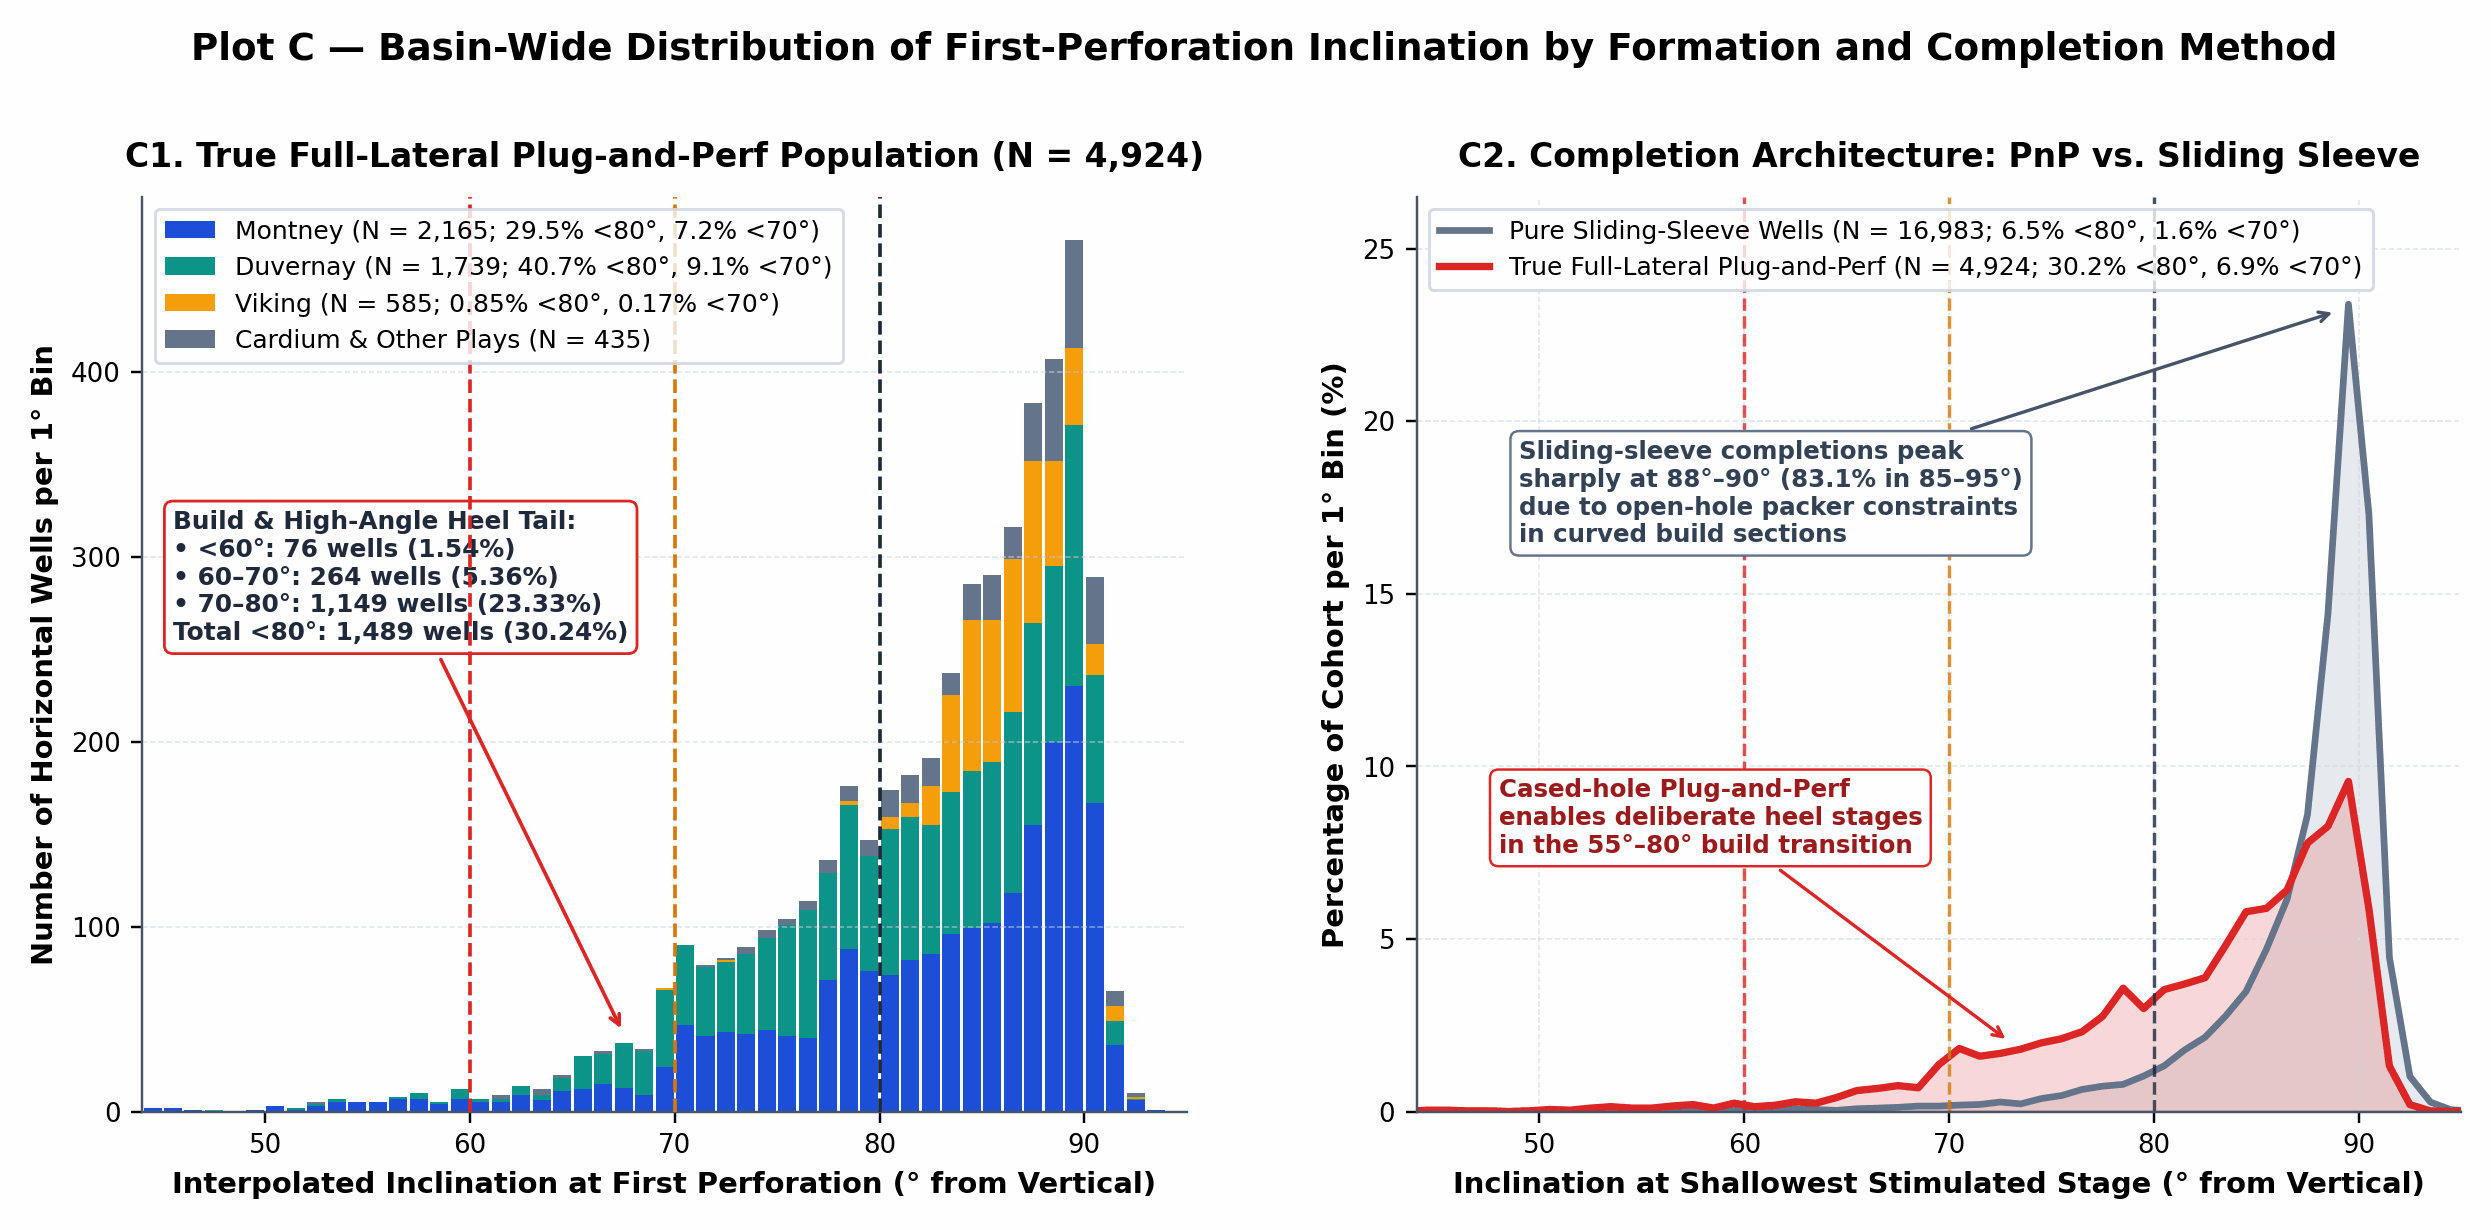
Plot C — Basin-Wide Distribution of First-Perforation Inclination: (C1) 1°-bin stacked histogram across all 4,924 QC-validated True Full-Lateral Plug-and-Perf horizontal wells by target formation, highlighting the 1,489-well (<80°) and 340-well (<70°) build/heel tail dominated by the Montney and Duvernay. (C2) Relative probability distribution comparing True Full-Lateral PnP (N = 4,924) against Pure Sliding-Sleeve horizontal wells (N = 16,983).
03Verified High-Inclination (~60°) Heel Perforation Examples
Individual perforation clusters (perf_events) and 3D wellbore surveys (wellbore) were audited across all 340 PnP wells initiating below 70°. Across the QC-validated population, 98.9% of all <80° heel perforations (67/72 in 50–60°, 273/278 in 60–70°, and 1,172/1,180 in 70–80°) are directly contiguous with the next deeper perforation cluster within ≤ 200 m (median inter-cluster spacing 11.7 m to 13.5 m). Auditing chronological sequence numbers (obs_no) and daily treatment dates (perf_date) confirms that hydraulic fracturing in every verified PnP example is pumped toe-to-heel: the ~60° build-section perforation is the shallowest-MD interval near the heel and is pumped as the final chronological stage on the last day of completion operations.
Table 2 — Inventory of 19 Verified WCSB Horizontal Wells with High-Inclination (~60° and Steep Build) Heel Perforations
| Licence & UWI | Operator & Field | Formation | 1st Perf MD (m) | Inc Top / Mid / Bot (°) | Perf TVD (m) | 88° Land MD / TVD (m) | ΔMD to 88° (ΔTVD m) | Span (m) / Stg | Frac Date & Prop (t) | 12m Cum BOE |
|---|---|---|---|---|---|---|---|---|---|---|
| 0499262 103023606306W600 | ARC Resources KAKWA | MONTNEY | 3427.0–3427.5 | 60.02° / 60.05° / 60.08° | 3,293.7 | 3,622.0 / 3,345.4 | 195.0 m (51.7 TVD) | 1,890.1 (28 stg) | 2021-05-05 4,238 t | 309,400 |
| 0517298 102030307208W600 | CNRL WEMBLEY | MONTNEY | 2453.0–2453.5 | 59.92° / 59.98° / 60.04° | 2,340.0 | 2,641.0 / 2,391.4 | 188.0 m (51.4 TVD) | 3,758.5 (57 stg) | 2026-03-17 7,530 t | N/A (2026) |
| 0481753 103041506220W500 | Whitecap Res. KAYBOB S | DUVERNAY | 3262.0–3262.5 | 60.11° / 60.18° / 60.25° | 3,164.9 | 3,343.0 / 3,186.0 | 81.0 m (21.1 TVD) | 2,143.4 (34 stg) | 2017-06-21 6,984 t | 119,200 |
| 0450898 100040906420W500 | Whitecap Res. KAYBOB | DUVERNAY | 3205.0–3206.0 | 59.90° / 60.10° / 60.31° | 3,122.7 | 3,306.8 / 3,146.9 | 101.8 m (24.2 TVD) | 1,452.0 (15 stg) | 2013-02-01 1,879 t | 52,200 |
| 0495424 100120706304W600 | ARC Resources KAKWA | MONTNEY | 3049.0–3049.5 | 59.83° / 59.89° / 59.94° | 2,942.0 | 3,241.3 / 2,995.5 | 192.3 m (53.5 TVD) | 2,566.5 (41 stg) | 2020-02-23 6,186 t | 183,300 |
| 0505147 102022906907W600 | Ovintiv Canada ELMWORTH | MONTNEY | 2452.0–2452.2 | 59.81° / 59.83° / 59.85° | 2,352.0 | 2,606.8 / 2,392.3 | 154.8 m (40.3 TVD) | 3,111.0 (39 stg) | 2022-09-12 8,125 t | 127,000 |
| 0472562 102063206124W500 | Kiwetinohk SAXON | DUVERNAY | 4013.0–4014.0 | 59.80° / 59.94° / 60.09° | 3,834.2 | 4,123.0 / 3,859.0 | 110.0 m (24.8 TVD) | 2,760.0 (40 stg) | 2016-03-01 7,429 t | 171,600 |
| 0508294 109082907108W600 | Ovintiv Canada WEMBLEY | MONTNEY | 2641.0–2641.3 | 60.24° / 60.29° / 60.33° | 2,540.5 | 2,753.0 / 2,568.3 | 112.0 m (27.8 TVD) | 3,390.0 (44 stg) | 2023-04-17 9,830 t | 155,700 |
| 0493322 102123206305W600 | ARC Resources KAKWA | MONTNEY | 3270.0–3270.5 | 60.28° / 60.34° / 60.40° | 3,153.2 | 3,436.3 / 3,196.7 | 166.3 m (43.5 TVD) | 2,528.8 (36 stg) | 2019-11-14 5,412 t | 226,400 |
| 0500676 103011807208W600 | Ovintiv Canada WEMBLEY | MONTNEY | 2880.0–2880.3 | 59.60° / 59.63° / 59.67° | 2,542.6 | 3,059.5 / 2,590.2 | 179.5 m (47.6 TVD) | 2,803.0 (37 stg) | 2021-05-26 6,105 t | 220,700 |
| 0472561 102103206124W500 | Kiwetinohk SAXON | DUVERNAY | 3920.0–3921.0 | 60.42° / 60.55° / 60.69° | 3,827.7 | 4,004.4 / 3,852.1 | 84.4 m (24.4 TVD) | 2,753.0 (39 stg) | 2016-02-28 7,044 t | 229,400 |
| 0509263 100143507208W600 | Ovintiv Canada WEMBLEY | MONTNEY | 2341.0–2341.3 | 59.56° / 59.60° / 59.65° | 2,192.4 | 2,510.7 / 2,236.2 | 169.7 m (43.8 TVD) | 2,914.0 (49 stg) | 2023-07-19 9,280 t | 215,900 |
| 0494528 102161106305W600 | ARC Resources KAKWA | MONTNEY | 3049.0–3049.5 | 59.47° / 59.54° / 59.61° | 2,984.9 | 3,223.8 / 3,029.6 | 174.8 m (44.7 TVD) | 2,994.5 (37 stg) | 2020-01-18 6,640 t | 226,900 |
| 0500675 102081807208W600 | Ovintiv Canada WEMBLEY | MONTNEY | 2775.0–2775.3 | 60.58° / 60.62° / 60.65° | 2,471.9 | 2,926.1 / 2,508.8 | 151.1 m (36.9 TVD) | 2,803.0 (37 stg) | 2021-05-25 6,105 t | 235,800 |
| 0476672 100130706121W500 | PetroChina KAYBOB S | DUVERNAY | 3608.0–3609.0 | 59.40° / 59.59° / 59.79° | 3,512.0 | 3,711.9 / 3,537.3 | 103.9 m (25.3 TVD) | 1,879.0 (31 stg) | 2016-10-12 4,520 t | 181,700 |
| 0493859 102051006221W500 | Whitecap Res. TONY CK N | DUVERNAY | 3616.0–3616.6 | 59.19° / 59.30° / 59.41° | 3,436.2 | 3,717.8 / 3,461.4 | 101.8 m (25.2 TVD) | 2,566.1 (40 stg) | 2019-07-04 7,810 t | 216,100 |
| 0467009 100120706323W500 | PetroChina WASKAHIGAN | DUVERNAY | 3581.5–3582.5 | 61.01° / 61.18° / 61.36° | 3,403.7 | 3,691.3 / 3,428.5 | 109.8 m (24.8 TVD) | 1,599.5 (26 stg) | 2015-03-19 3,640 t | 137,800 |
| 0517304 100010907208W600 | CNRL WEMBLEY | MONTNEY | 2389.0–2389.5 | 57.53° / 57.60° / 57.66° | 2,277.3 | 2,578.6 / 2,324.4 | 189.6 m (47.1 TVD) | 3,710.5 (56 stg) | 2026-03-18 8,125 t | N/A (2026) |
| 0500678 100021807208W600 | Ovintiv Canada WEMBLEY | MONTNEY | 2703.0–2703.3 | 50.67° / 50.71° / 50.74° | 2,450.2 | 2,926.1 / 2,514.1 | 223.1 m (63.9 TVD) | 2,732.0 (36 stg) | 2021-05-26 5,940 t | 263,400 |
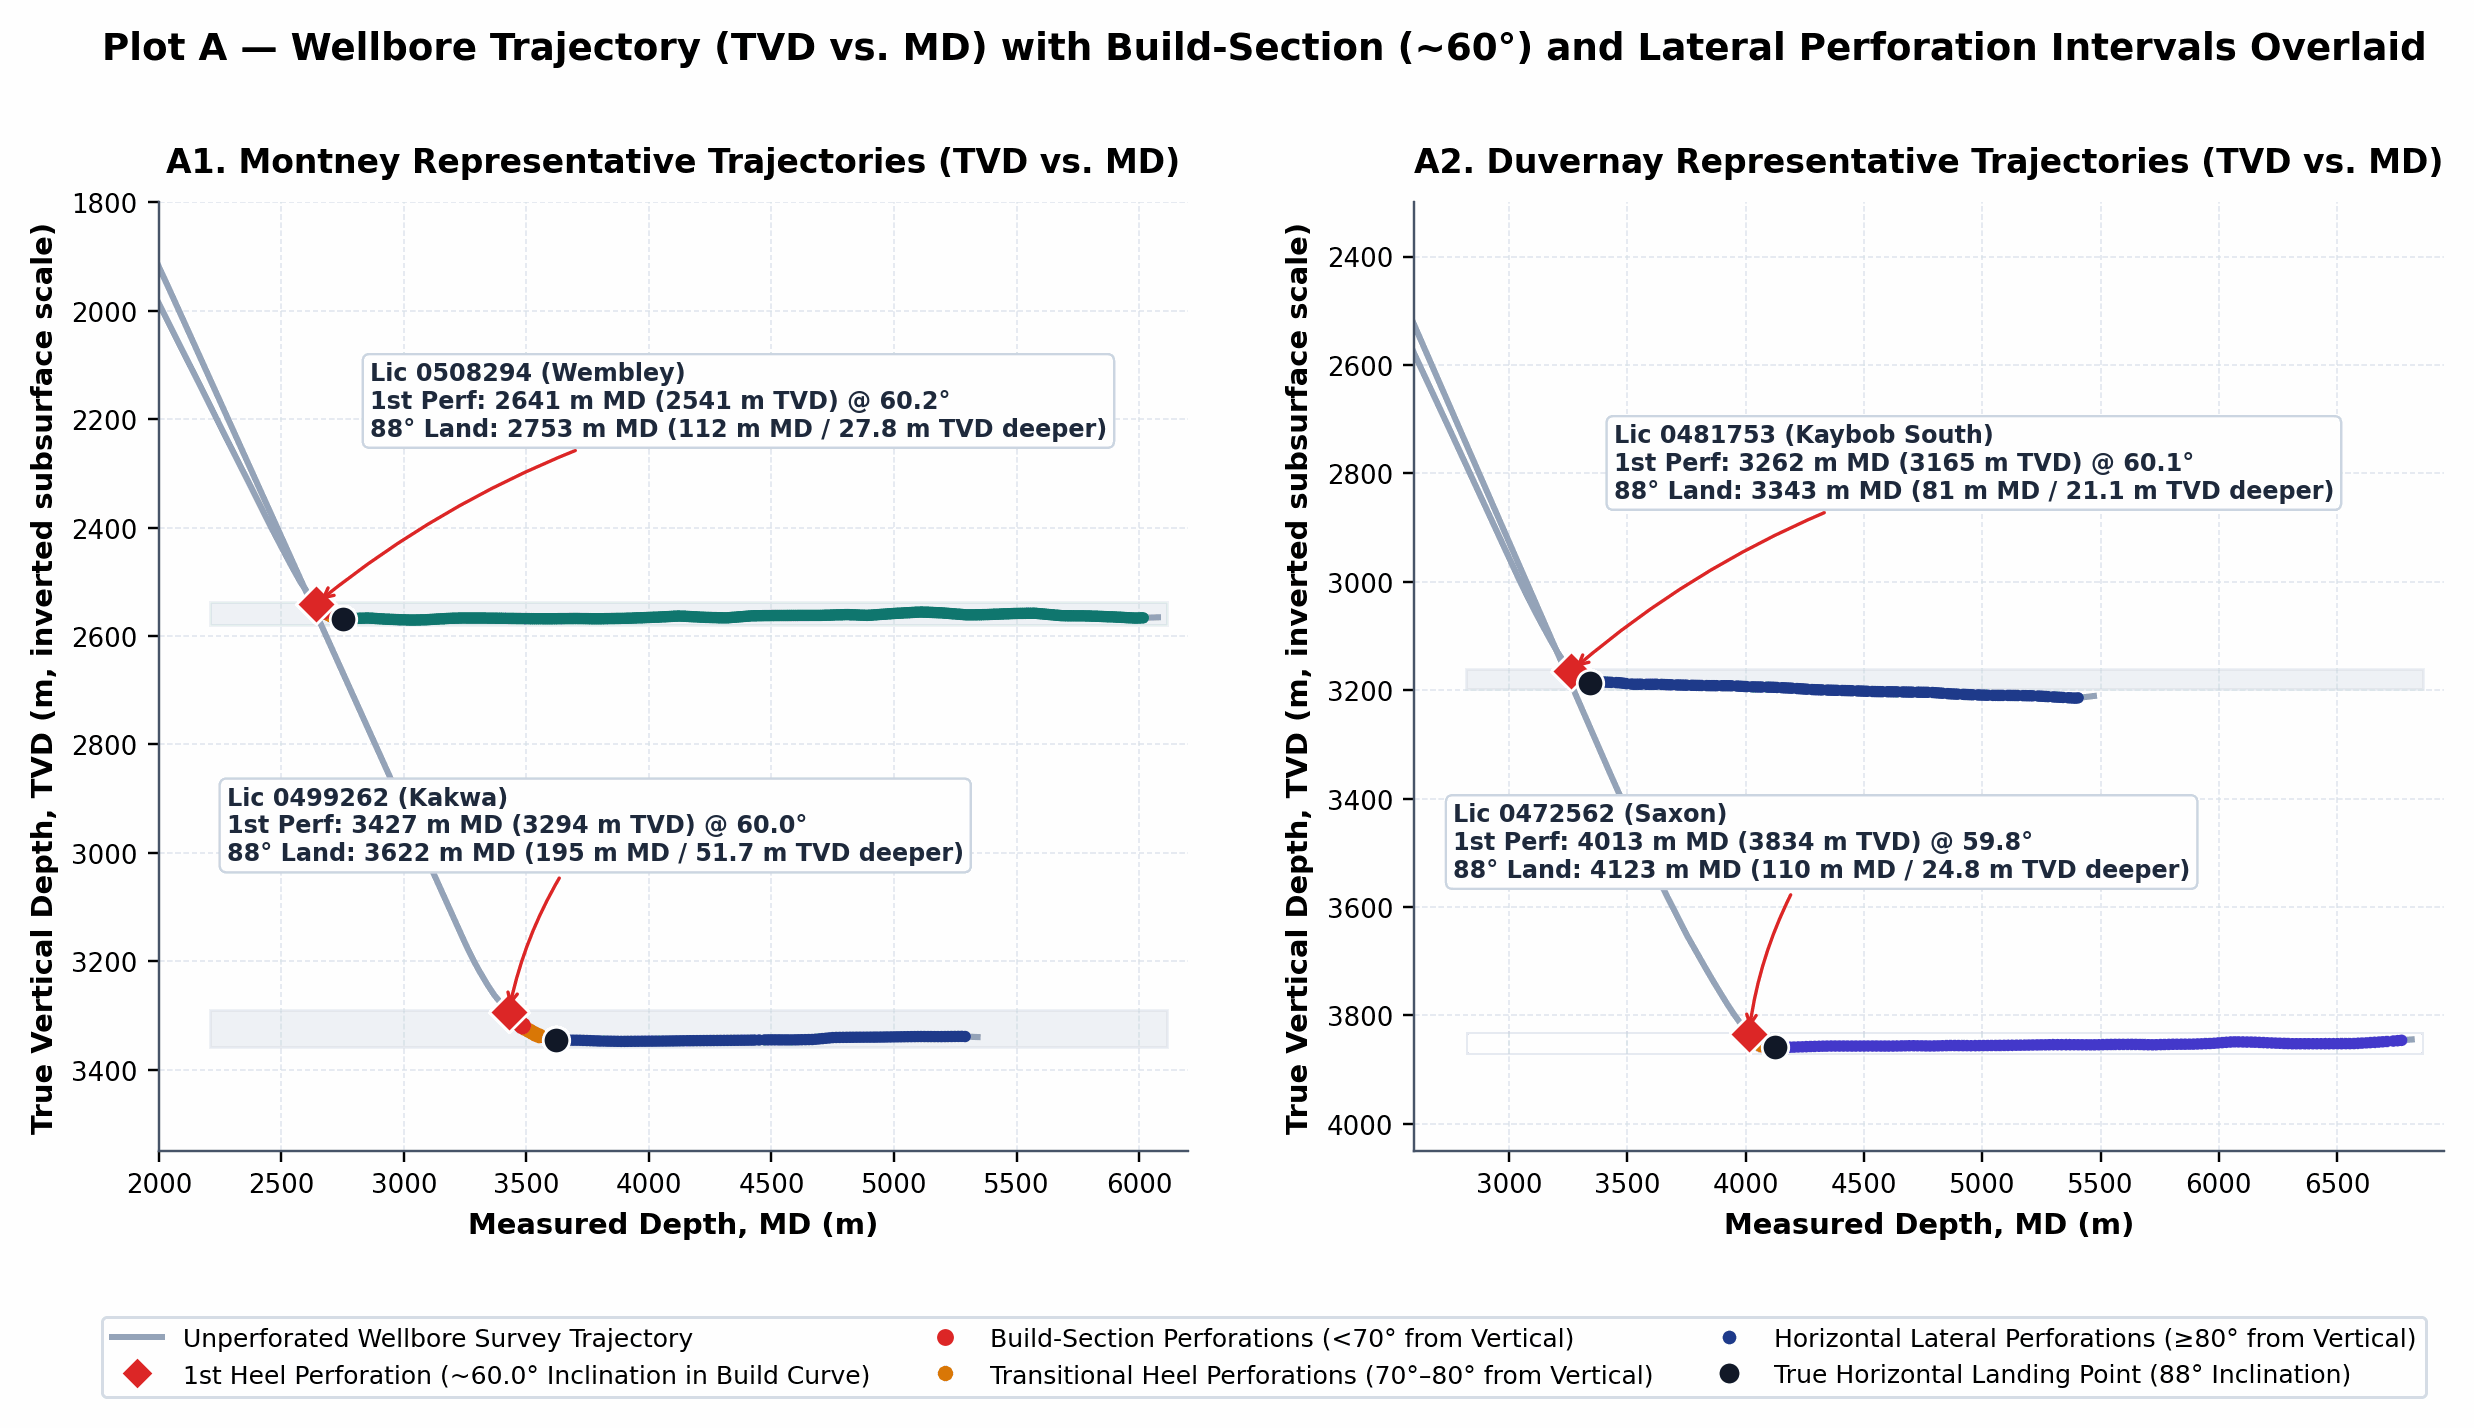
Plot A — Wellbore Trajectory (TVD vs. MD) with Perforation Intervals Overlaid: (A1) Montney verified ~60° examples (ARC Kakwa 0499262 at 60.0° and Ovintiv Wembley 0508294 at 60.2°) and (A2) Duvernay verified ~60° examples (Whitecap Kaybob South 0481753 at 60.1° and Kiwetinohk Saxon 0472562 at 59.8°).
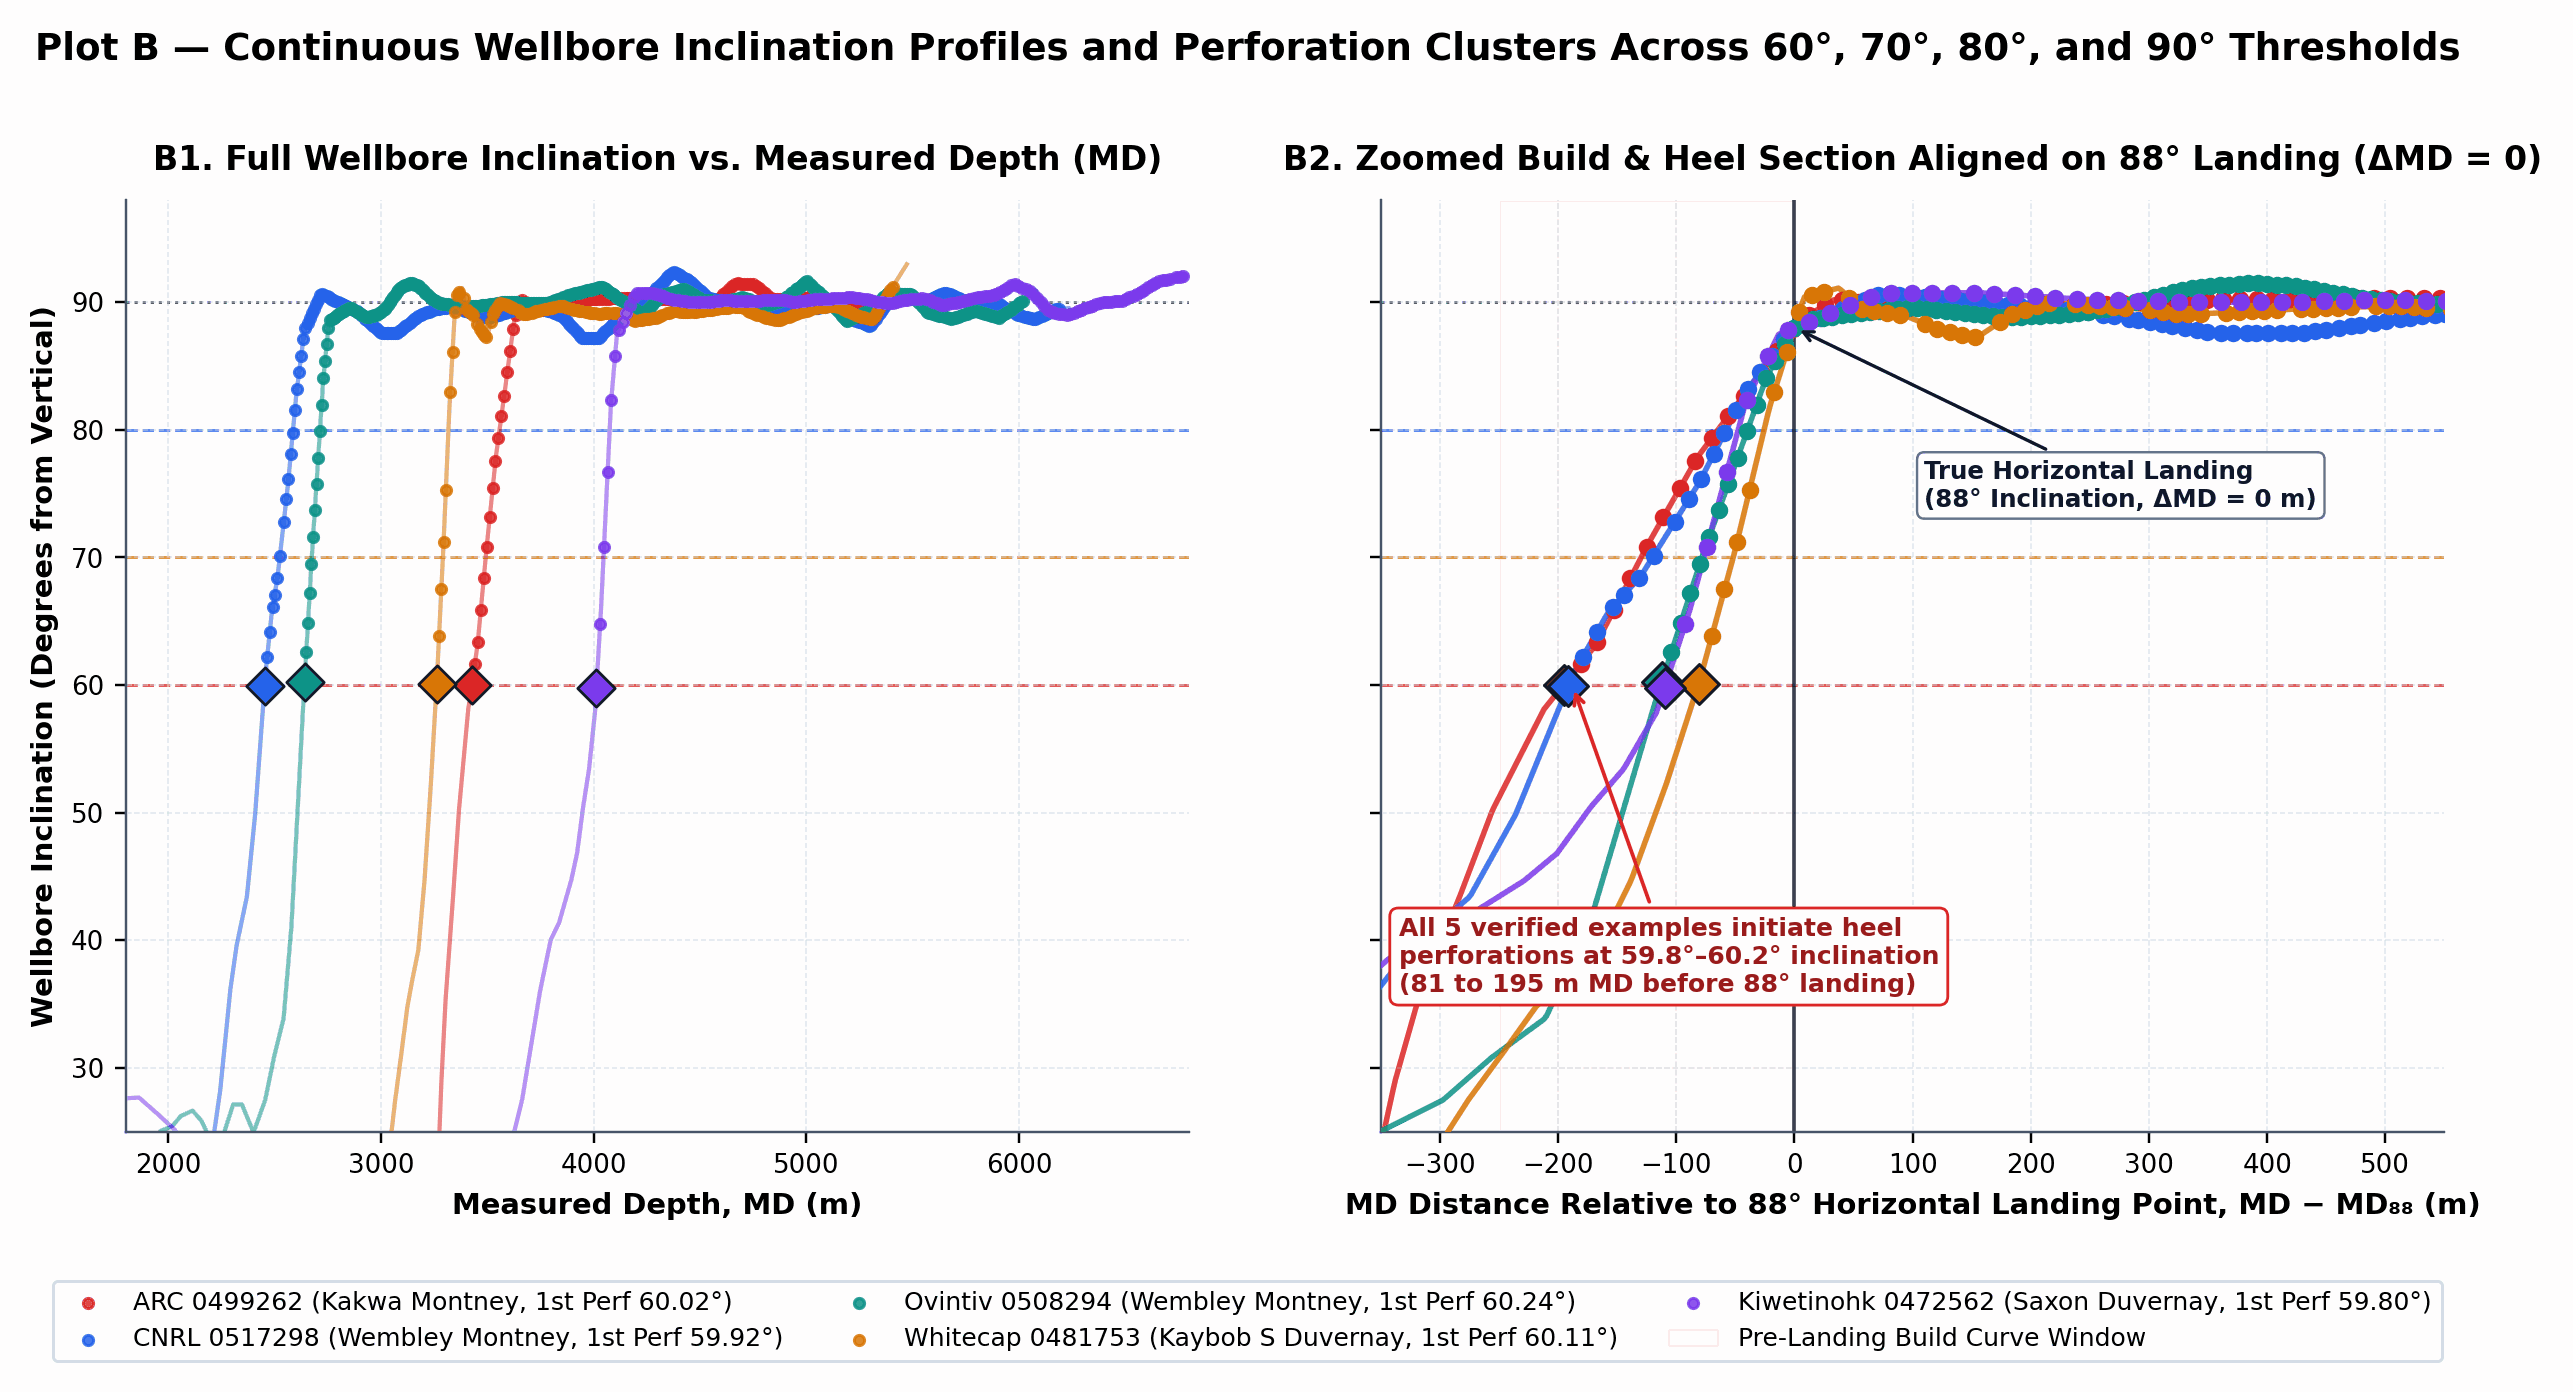
Plot B — Continuous Wellbore Inclination Profiles Across 60°, 70°, 80°, and 90° Thresholds: (B1) Full wellbore inclination versus measured depth (MD) and (B2) zoomed build/heel window aligned on each well's 88° horizontal landing point (ΔMD = MD - MD_88 = 0).
04Subsurface, Geometric & Operational Observations
Combining directional surveys, AER petrophysical evaluations (reservoir_evaluation), and multi-well pad geometry highlights four empirical factors associated with ~60° heel perforations:
4.1 Reservoir Thickness and Early Pay Contact During the Build Curve
In a directional build curve with build rate B = 5.0° to 8.0° per 30 m (R ≈ 215 to 344 m), the vertical elevation difference between inclination θ_1 = 60° and horizontal landing (θ_2 = 90°) is ΔTVD = R · (sin 90° - sin 60°) = 0.1340 · R ≈ 28.8 to 46.1 m TVD over an arc length of 112.5 to 180.0 m MD. In thin reservoirs such as the Viking (median AER log_net_pay_m = 3.2 m) or Cardium (10.5 m), a wellbore at 60° inclination (25–50 m TVD above its landing target) has not yet entered the target sand and is still traversing overlying marine shale. Conversely, in the Duvernay (gross shale thickness 35–55 m, median AER log_net_pay_m = 28.5 m, landed near the base of the Lower Duvernay) and Montney (gross siltstone thickness 150–300 m, median AER log_net_pay_m = 38.8 m), the wellbore enters hydrocarbon-bearing target rock at 50°–65° inclination. Across all verified Duvernay ~60° examples in Table 2 (0481753, 0450898, 0472562, 0472561, 0476672, 0493859, 0467009), the vertical elevation difference between the 88° Lower Duvernay landing depth and the 60° first perforation is consistently 21.1 to 25.3 m TVD, matching the AER-evaluated net pay thickness (27.3 to 30.8 m).
4.2 Multi-Bench Cube Pad Development & Vertical Heel-Setback Alignment
Analyzing all 72 multi-well Montney pads (596 horizontal wells) that contain both <70° heel-perforated wells and ≥80° conventional sibling wells on the same surface location shows that stacked multi-bench (cube) pad geometry strongly influences heel perforation inclination. Across those 72 pads, the <70° wells are landed at a mean depth of 66.5 m TVD below the shallowest Montney bench on the pad, compared to 31.9 m TVD for sibling wells initiated at ≥80°:
- Ovintiv Wembley Multi-Bench Cube (Pads
05-31-071-08W6&06-06-072-08W6, Plot F1): Upper Montney wells (0498693at2,442.6 m TVDand0498701at2,446.5 m TVD) sit just below the~2,435 m TVDTop of Montney marker and initiate perforations at 83.99° and 79.90° (1.7–4.3 m TVDabove landing). Deeper Middle Montney wells (0500675at2,508.8 m TVD,0500678at2,514.1 m TVD) and Lower Montney wells (0508294at2,568.3 m TVD,0498691at2,570.9 m TVD,0500676at2,590.2 m TVD) on the same pads are already 35 to 110 m inside the Montney pay column while building through 50°–63°, initiating perforations at 50.67° to 62.66° (112–223 m MDbefore landing). - ARC Resources Kakwa Pad
01-02-064-06W6(Licences0499260,0499261,0499262, Plot F2): Upper bench0499261(3,298.6 m TVD) and deeper bench0499262(3,345.4 m TVD,46.8 m TVDdeeper) both initiate their heel-most perforation at the exact same measured depth (3,427.0 m MD) and aligned radial horizontal stepout from the surface pad (525.1 m vs. 548.3 m). Because0499262is still building angle to reach its deeper target,3,427.0 m MDcorresponds to 60.02° inclination on0499262versus 71.52° on0499261. Waiting for0499262to reach 88° (at3,622.0 m MD,677.2 mradial offset) would leave 129 m of horizontal setback and 51.7 m TVD of Montney pay unstimulated at the heel of the lower bench.
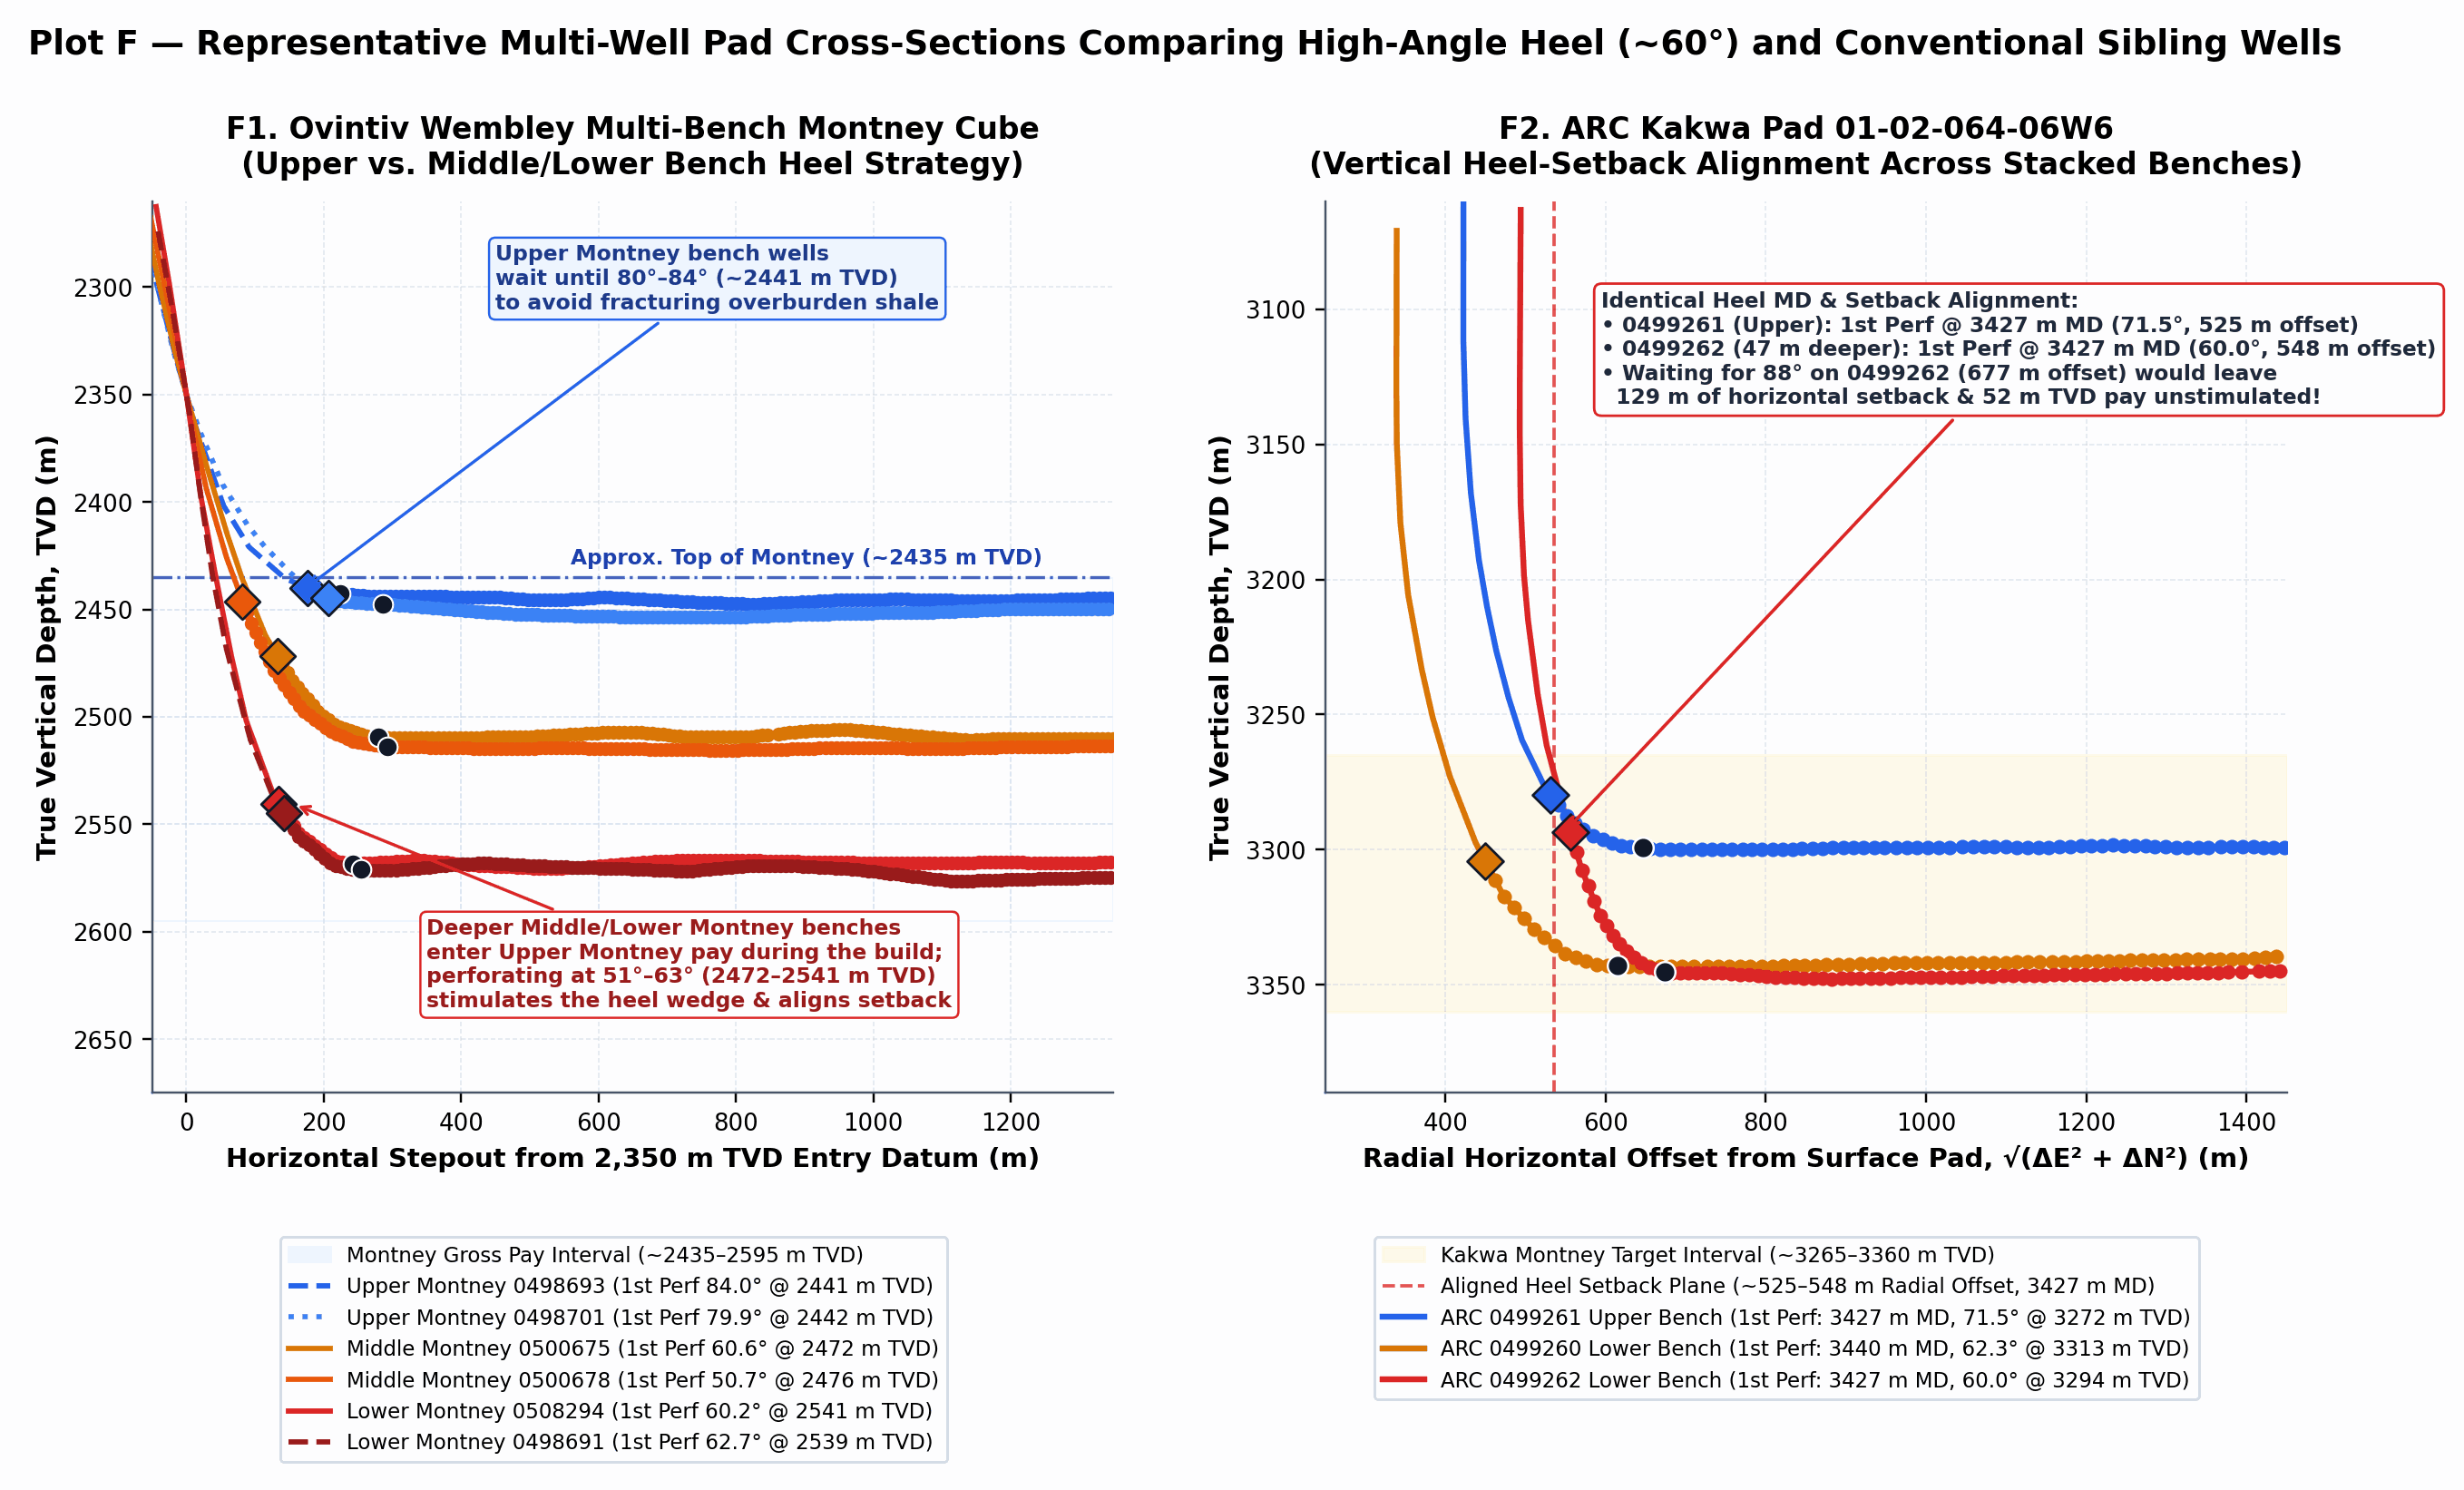
Plot F — Multi-Well Pad Cross-Sections Comparing High-Angle Heel (~60°) and Conventional Sibling Wells: (F1) Ovintiv Wembley Montney cube and (F2) ARC Kakwa 01-02-064-06W6 pad plotted against radial horizontal offset √(ΔE² + ΔN²) from the surface pad.
4.3 Borehole Orientation, Stress Field Context, and Public Data Limitations
In Kakwa, Wembley, Kaybob, and Saxon, maximum horizontal stress (σ_Hmax) is oriented NE–SW (N40°E–N55°E), and horizontal laterals are predominantly drilled NW–SE (N45°W / S45°E). A wellbore building inclination through 60° in the NW–SE vertical plane remains orthogonal to σ_Hmax. However, a 60–80 m build stage at 60° spans 20–35 m of vertical depth, creating a 200–350 kPa hydrostatic pressure difference between the shallowest and deepest perforation clusters of the stage. Because public Alberta perf_events filings do not record stage-level surface treating pressures or microseismic geometry, breakdown pressures and near-wellbore tortuosity in 60° stages cannot be directly quantified from public regulatory records.
05Formation-Level & Operator-Level Concentration Across the WCSB
Table 3 and Plot D summarize the concentration of high-inclination heel perforations across major WCSB formations (≥20 QC-validated PnP wells) alongside AER reservoir evaluation metrics (log_net_pay_m). Thick siltstone and shale formations (Duvernay: 40.71% <80°, 9.09% <70°; Montney: 29.48% <80°, 7.21% <70°, 2.40% <60°; and Falher: 35.09% <80°, 15.79% <70°) account for over 95% of all <70° completions, whereas thin-bedded formations (Viking: 0.85% <80°, 0.17% <70°, 0.00% <60°; Cardium: 0.62% <70°, 0.00% <60°; Basal Quartz, Slave Point, Mannville: 0.00% <70°) rarely initiate stages below 80°.
Table 3 — Formation-Level Prevalence of High-Inclination Heel Perforations vs. AER Reservoir Net Pay Thickness (True Full PnP)
| Target Formation | QC PnP Wells (N) | 1st Perf < 60° Count (%) | 1st Perf < 70° Count (%) | 1st Perf < 80° Count (%) | Median 1st Perf Inc (°) | P10 1st Perf Inc (°) | Median AER Net Pay (m) | Med Span / Lateral (%) |
|---|---|---|---|---|---|---|---|---|
| DUVERNAY | 1,739 | 15 (0.86%) | 158 (9.09%) | 708 (40.71%) | 81.89° | 70.35° | 28.5 m | 91.5% |
| FALHER (Spirit River) | 57 | 3 (5.26%) | 9 (15.79%) | 20 (35.09%) | 83.12° | 65.40° | 18.2 m | 92.4% |
| MONTNEY | 2,165 | 52 (2.40%) | 156 (7.21%) | 638 (29.48%) | 84.61° | 71.84° | 38.8 m | 92.8% |
| ROCK CREEK | 27 | 1 (3.70%) | 2 (7.41%) | 5 (18.52%) | 86.10° | 73.20° | 14.5 m | 90.1% |
| ELLERSLIE | 32 | 0 (0.00%) | 1 (3.13%) | 5 (15.63%) | 85.85° | 76.40° | 11.4 m | 89.6% |
| DOIG | 21 | 0 (0.00%) | 0 (0.00%) | 3 (14.29%) | 86.42° | 78.15° | 16.0 m | 90.8% |
| CARDIUM | 162 | 0 (0.00%) | 1 (0.62%) | 20 (12.35%) | 86.95° | 79.40° | 10.5 m | 88.9% |
| GLAUCONITIC | 55 | 0 (0.00%) | 1 (1.82%) | 6 (10.91%) | 86.70° | 79.80° | 12.0 m | 89.2% |
| BASAL QUARTZ | 50 | 0 (0.00%) | 0 (0.00%) | 2 (4.00%) | 87.50° | 82.60° | 7.0 m | 88.4% |
| VIKING | 585 | 0 (0.00%) | 1 (0.17%) | 5 (0.85%) | 86.34° | 83.41° | 3.2 m | 89.0% |
| SLAVE POINT & MANNVILLE | 60 | 0 (0.00%) | 0 (0.00%) | 0 (0.00%) | 87.80° | 84.50° | 5.5 m | 87.8% |
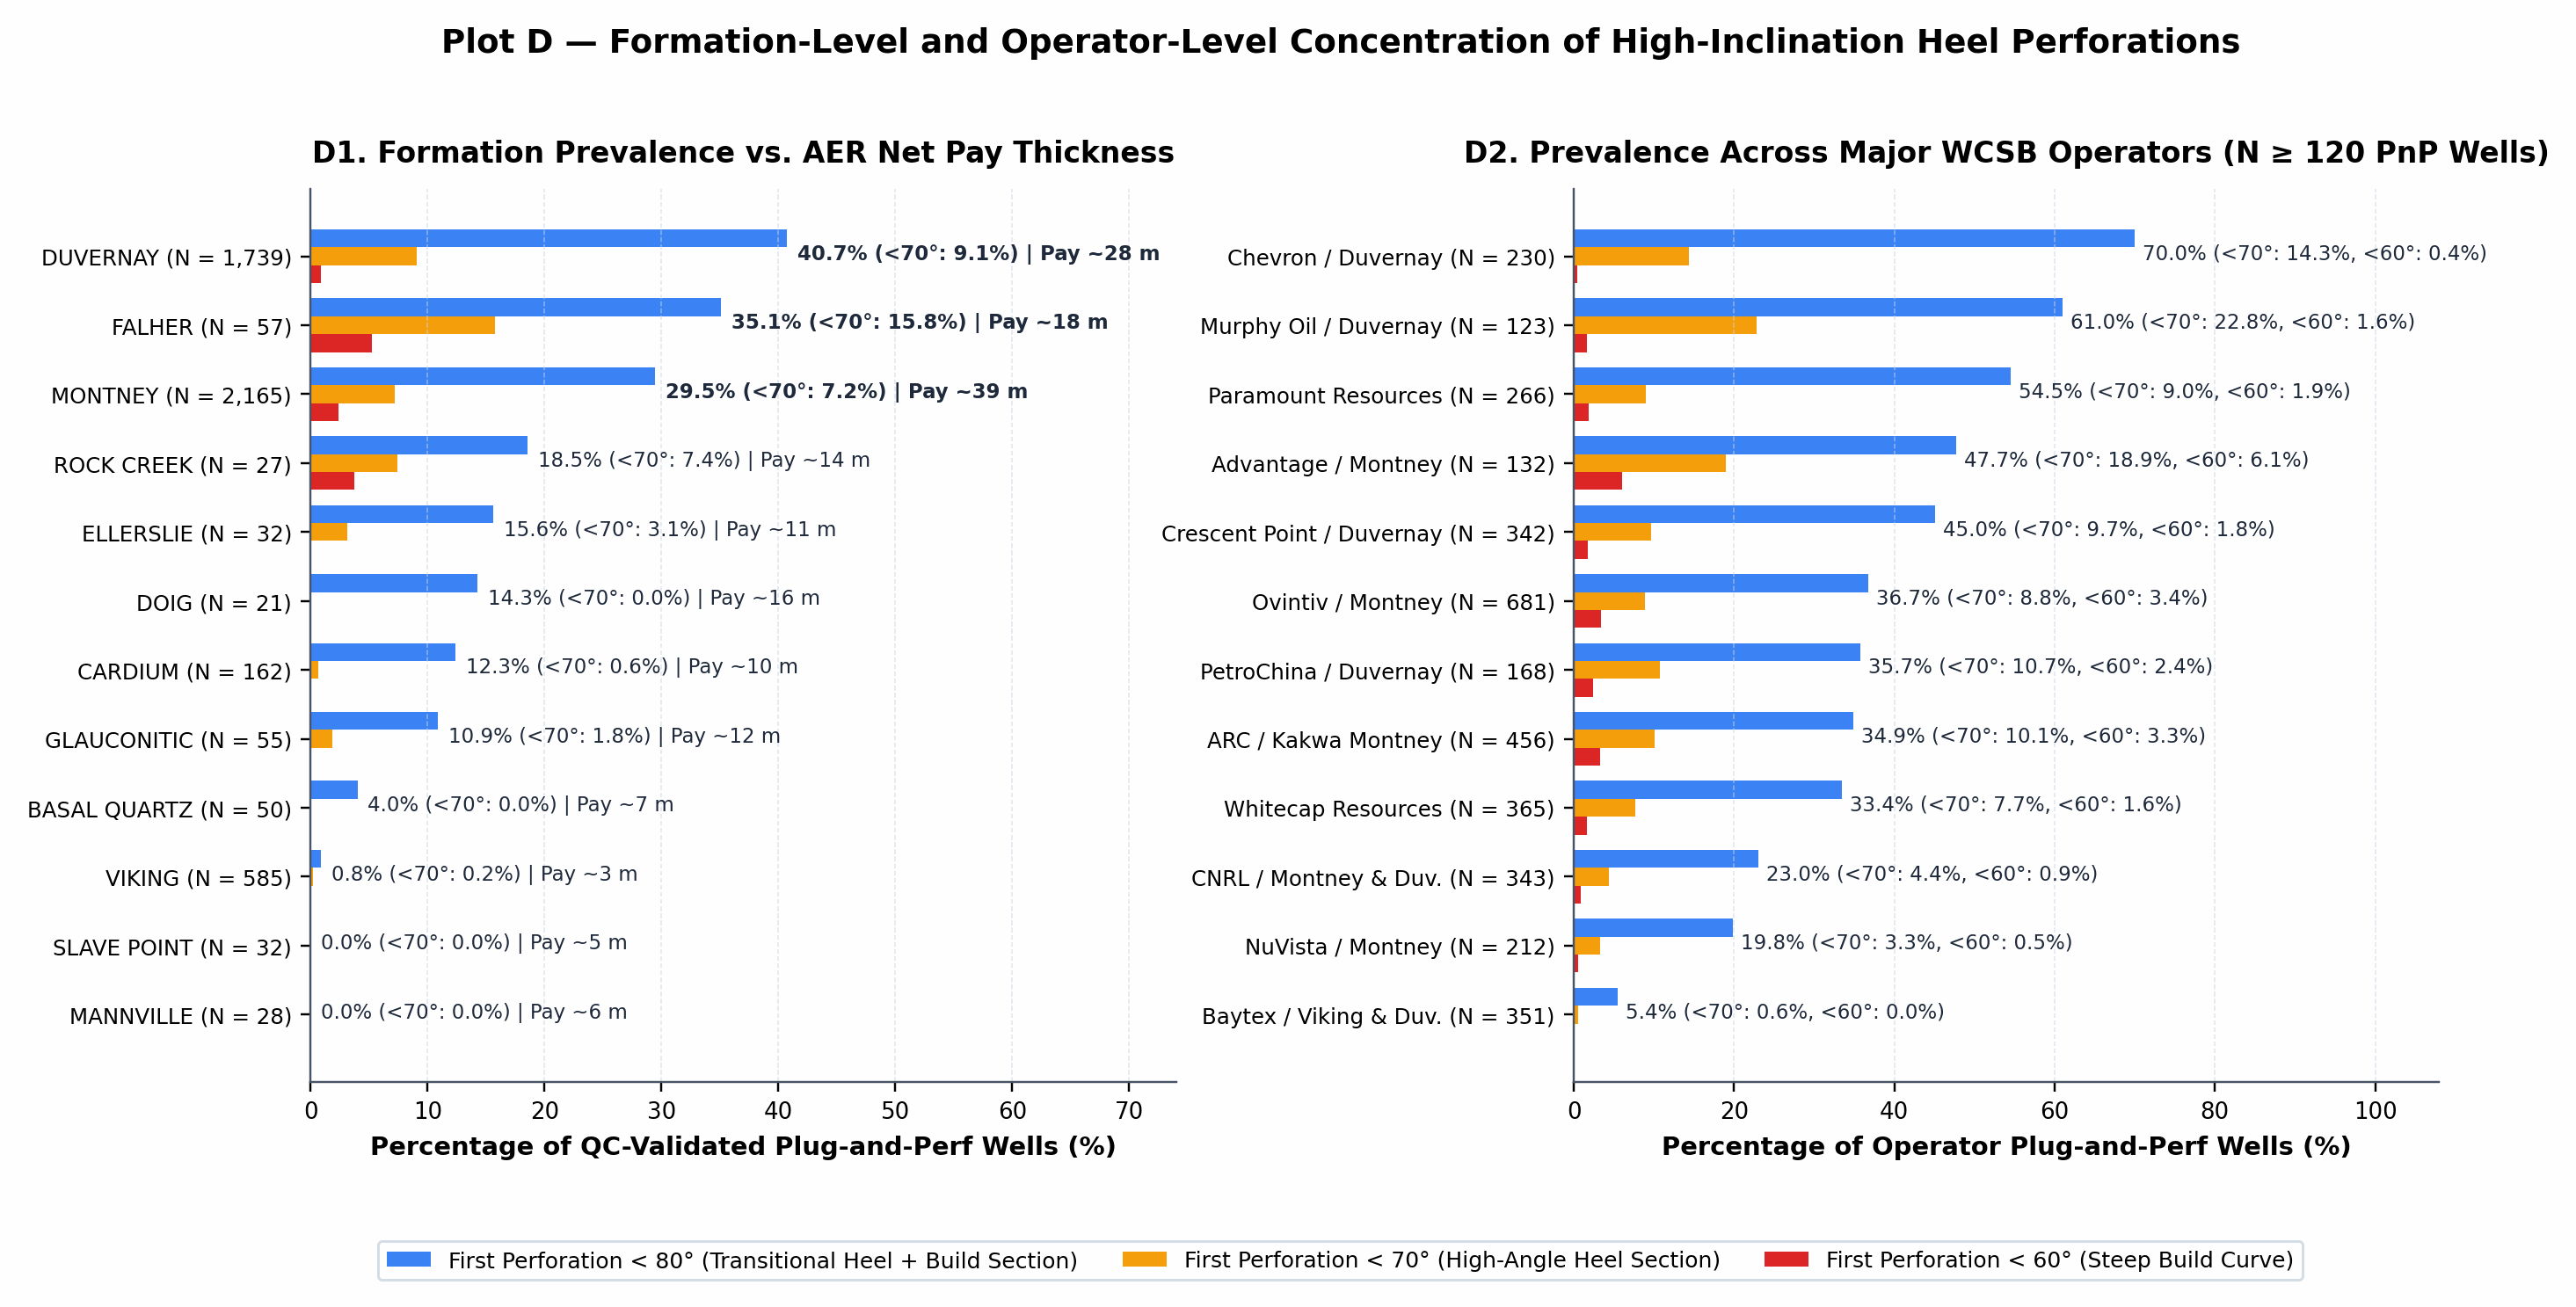
Plot D — Formation-Level and Operator-Level Concentration of High-Inclination Heel Perforations: (D1) Percentage of QC-validated Plug-and-Perf horizontal wells initiating perforations below 80°, 70°, and 60° across 12 WCSB formations alongside median AER net pay thickness. (D2) Prevalence across the 12 largest WCSB Plug-and-Perf operators (N ≥ 120 wells).
06Controlled Completion Coverage & Normalized Production Comparison
To compare completion coverage and hydrocarbon volumes across inclination bands while controlling for formation and vintage, matched cohorts were compiled for producing True Full-Lateral PnP wells completed between 2016 and 2025 (completed span 1,000–4,500 m, proppant >500 t) in the Core Montney (Kakwa, Wembley, Elmworth, Karr; N = 1,490) and Core Duvernay (Kaybob South, Kaybob, Saxon, Waskahigan, Tony Creek North; N = 788). Table 4 and Plot E summarize completion parameters and 6-month / 12-month cumulative BOE across inclination cohorts.
Table 4 — Controlled Cohort Comparison of Completion Parameters and Normalized Production in Core Montney and Core Duvernay
| Cohort & Inclination Band | Wells (12m) | Med. Year | Med. Span (m) | Span / Lat (%) | Stg / Space (m) | Prop (t/m) | Water (m³/m) | Med 6m BOE | Med 12m BOE | 12m BOE / km | 12m BOE / t Prop | 12m Uptime |
|---|---|---|---|---|---|---|---|---|---|---|---|---|
| Core Montney: < 60° (Med 55.4°) | 35 | 2020 | 2,732 | 98.4% | 36 / 75.0 | 2.33 | 10.42 | 128,400 | 205,100 | 76,580 | 32.3 | 87.6% |
| Core Montney: 60–70° (Med 66.2°) | 84 | 2021 | 2,640 | 96.7% | 36 / 73.0 | 2.21 | 10.85 | 124,900 | 194,800 | 72,566 | 32.3 | 88.1% |
| Core Montney: 70–80° (Med 75.8°) | 390 | 2021 | 2,665 | 94.7% | 36 / 74.0 | 2.38 | 10.90 | 126,200 | 196,400 | 73,820 | 32.4 | 87.9% |
| Core Montney: 80–85° (Med 82.7°) | 319 | 2021 | 2,612 | 93.2% | 35 / 75.0 | 2.32 | 10.65 | 122,800 | 191,200 | 73,110 | 31.9 | 88.2% |
| Core Montney: 85–95° Ref (Med 88.4°) | 662 | 2020 | 2,510 | 90.4% | 34 / 75.0 | 2.15 | 10.12 | 111,500 | 174,800 | 69,750 | 31.2 | 87.4% |
| Core Duvernay: < 60° (Med 57.1°) | 9 | 2016 | 2,143 | 97.1% | 31 / 68.0 | 2.46 | 18.40 | 51,200 | 72,900 | 34,120 | 14.3 | 86.4% |
| Core Duvernay: 60–70° (Med 66.8°) | 76 | 2019 | 2,580 | 94.5% | 45 / 55.0 | 2.72 | 18.90 | 96,400 | 140,200 | 54,327 | 17.5 | 87.8% |
| Core Duvernay: 70–80° (Med 75.6°) | 281 | 2019 | 2,540 | 92.7% | 42 / 60.0 | 2.94 | 19.10 | 71,800 | 103,300 | 40,686 | 14.5 | 87.1% |
| Core Duvernay: 80–85° (Med 82.5°) | 186 | 2018 | 2,410 | 91.1% | 38 / 63.0 | 2.45 | 17.80 | 62,400 | 91,800 | 38,090 | 16.5 | 86.9% |
| Core Duvernay: 85–95° Ref (Med 87.9°) | 236 | 2018 | 2,290 | 89.5% | 35 / 65.0 | 2.11 | 16.95 | 58,900 | 85,500 | 37,351 | 17.2 | 87.3% |
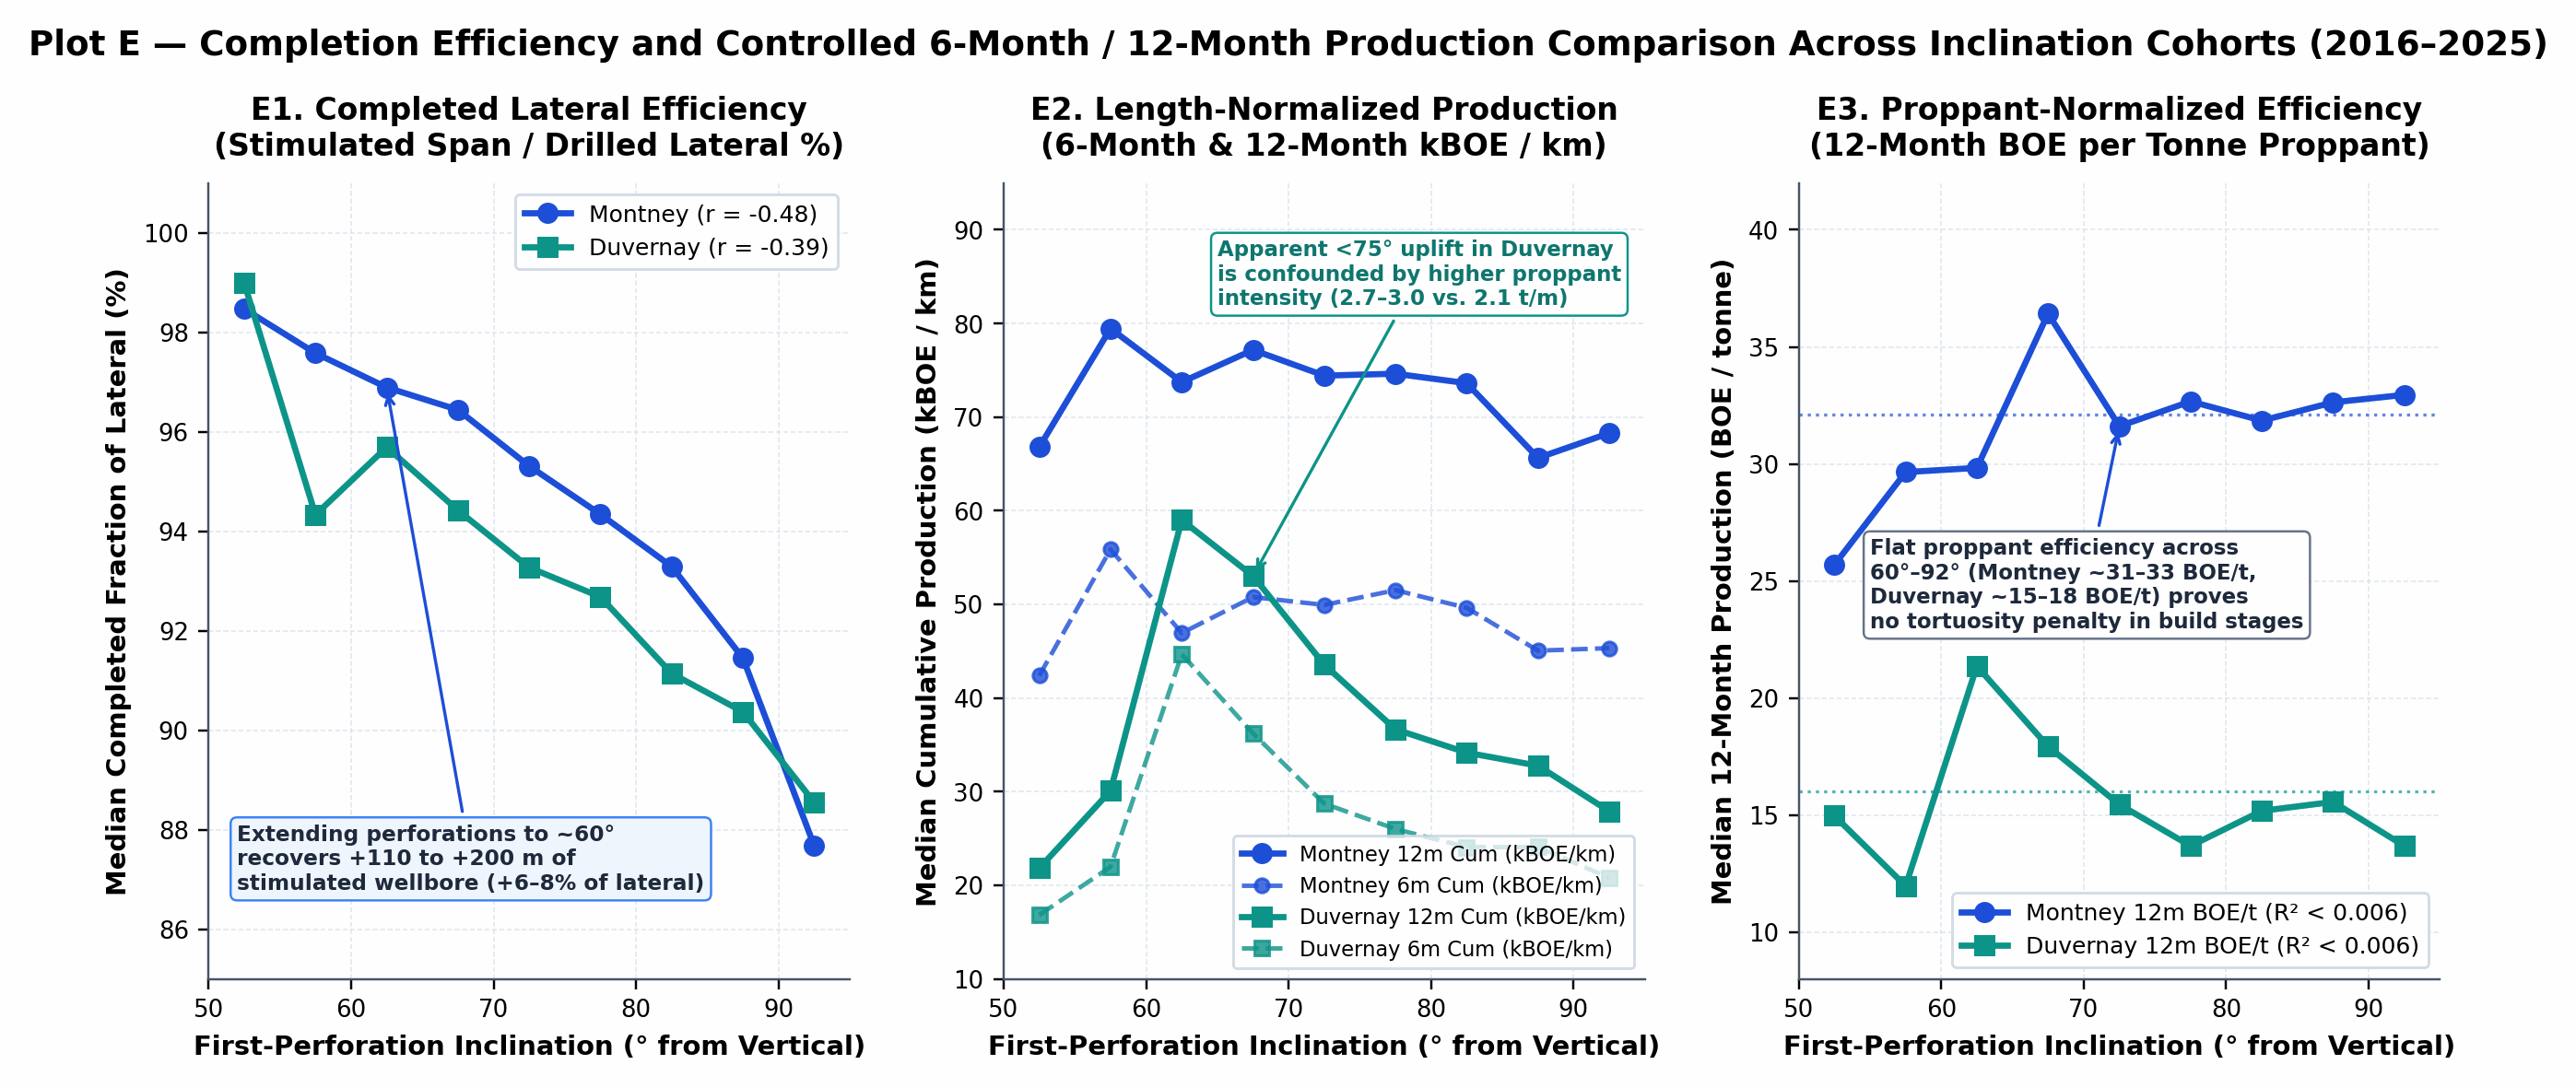
Plot E — Completion Coverage and Controlled 6-Month / 12-Month Production Comparison (5° Bins, 2016–2025): (E1) Completed fraction of lateral (span_m / lateral_m), (E2) length-normalized 6-month and 12-month kBOE/km, and (E3) proppant-normalized 12-month BOE/tonne.
- Completed Wellbore Length Coverage (
E1): Initiating perforations at 60° instead of waiting for 88°–90° increases the stimulated fraction of the drilled lateral from 90.4% to 96.7%–98.4% in the Montney and from 89.5% to 94.5%–97.1% in the Duvernay, adding 110 to 200 m of completed wellbore (2 to 5 stages) per well. - Confounding Variables in Raw & Per-Metre Volumes (
E2): In the Duvernay, raw and per-kilometre 12-month cumulative BOE appear 45% higher in the 60°–70° cohort (54,327 BOE/km) than in the 85°–95° reference group (37,351 BOE/km), reflecting operator selection bias and 29% higher proppant intensity (2.72 t/mvs.2.11 t/m) rather than inclination alone. - Proppant-Normalized Parity (
E3): Once normalized by proppant placed, 12-month cumulative BOE per tonne is invariant across the 60°–92° spectrum: 32.3 BOE/t (<70°) vs. 31.2 BOE/t (85–95°) in the Montney (r = -0.0134,R² = 0.00018,p = 0.56), and 17.5 BOE/t (60–70°) vs. 17.2 BOE/t (85–95°) in the Duvernay (r = -0.0748,R² = 0.00559), with identical 12-month uptime (86.4%–88.2%).
07Data Quality Validation & Further Data Collection
All joined records were screened for depth consistency (|MD_well - MD_survey| ≤ 50 m, excluding 6 horizontal wells [0.03%]), survey station spacing (≤ 200 m, excluding 36 coarse-survey wells [0.62%]), horizontal landing (θ_max ≥ 85°, isolating 30 slant wells [0.13%]), and proppant disclosure validity (excluding corrupted outliers 0455531, 0457253, and 0450853 with proppant_tonnes > 50,000 t). Additional field datasets that could complement these public records include 1-second surface treating pressure logs, fiber-optic DAS/DTS cluster distribution logs, and inter-well pressure-monitoring records across stacked multi-bench pads.